Bolt 1.4 |
Bolt is a logging tool for the OCaml language1. Its name stems from the following acronym: Bolt is an Ocaml Logging Tool. It is inspired by and modeled after the Apache log4j utility2.
Bolt provides both a comprehensive library for log production, and a camlp4-based syntax extension that allows to remove log directives. The latter is useful to be able to distribute an executable that incurs no runtime penalty if logging is used only during development.
The importance of logging is frequently overlooked but (quite ironically), in the same time, the most used debugging method is by far the print statement. Bolt aims at providing OCaml developers with a framework that is comprehensive, yet easy to use. It also tries to leverage the benefits of both compile-time and run-time configuration to produce a flexible library with a manageable computational cost.
Bolt is distributed under the terms of the lgpl version 3. This licensing scheme allows to use Bolt in any software, not contaminating code.
In order to improve the project, I am primarily looking for testers and bug reporters. Pointing errors in documentation and indicating where it should be enhanced is also very helpful.
Bugs and feature requests can be made at http://bugs.x9c.fr.
Other requests can be sent to bolt@x9c.fr.
Before starting to build Bolt, one first has to check that dependencies are already installed. The following elements are needed in order to build Bolt:
The configuration of Bolt is done by executing ./configure. One can specify elements if they are not correctly inferred by the configure script; the following switches are available:
The Java2 version will be built only if the ocamljava3 compiler is present and located by the makefile. The syntax extension will be compiled only to bytecode.
The actual build of Bolt is launched by executing make all. When build is finished, it is possible to run some simple tests by running make tests. Documentation can be generated by running make doc.
Bolt is installed by executing make install. According to local settings, it may be necessary to acquire privileged accesses, running for example sudo make install. The actual installation directory depends on the use of ocamlfind: if present the files are placed inside the Findlib hierarchy, otherwise they are placed in the directory ‘ocamlc -where‘/bolt (i. e. $PREFIX/lib/ocaml/bolt).
The central concept of Bolt is the one of loggers. Loggers have names that are strings composed of dot-separated components; they are thus akin to module names, and it is actually good practice to use the logger M to log events of the module M. It is possible to register several loggers with the same name; this feature is useful to record the events related to a given module to several different destinations (using possibly different filters, layout, and outputs).
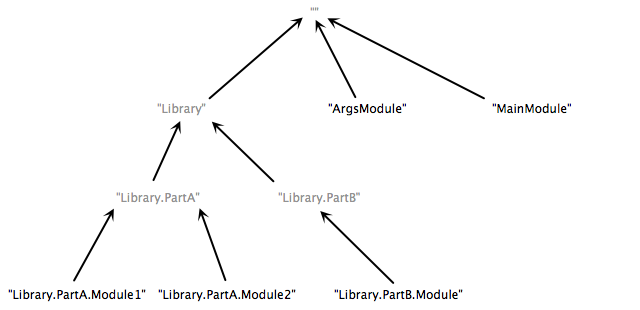
Loggers are also organized into a hierarchy (meaning that logger P is a parent of logger P.S). When a log statement is executed, it is associated with a logger name. Figure 3.1 shows the hierarchy of loggers for an application using the loggers whose name appears in black. The loggers whose names appear in gray are implicitly added by Bolt in order to have a complete tree of loggers: those actually used in the program are the leaves, and the root is the special "" (i. e. empty name) logger. The arrows define the is-a-child-of relation.
Events are the entities built each time the running program executes a log statement. The event carries all the information needed for efficient logging: message, location, time, logger name, etc. Some information is explicitly provided by the user (e. g. message or properties), while some information is implicitly computed by the runtime (e. g. time or process identifier).
Level characterizes how critical an event is. Each logger has as associated level that indicates which levels it is interested in. An event will be recorded iff its level is below the level of logger. The levels are, in ascending order:
A filter is basically a predicate over events, allowing to determine whether an event should be recorded by a condition on any element of the events. Each logger has an associated filter, ensuring that only the events satisfying the filter will be recorded.
Each logger has an associated layout that is responsible for the conversion of events into bare strings that can then be easily manipulated.
Each logger has an associated mode that is reponsible for sending data to the output. A mode allows to buffer data, in order to mitigate performances issues related to logging.
Each logger has an associated output that defines where event are actually recorded. An output is thus responsible for the storage of events, once they have been converted into strings by a layout. The most simple output is the file, and in this case, safety commands that two loggers should not have the same destination.
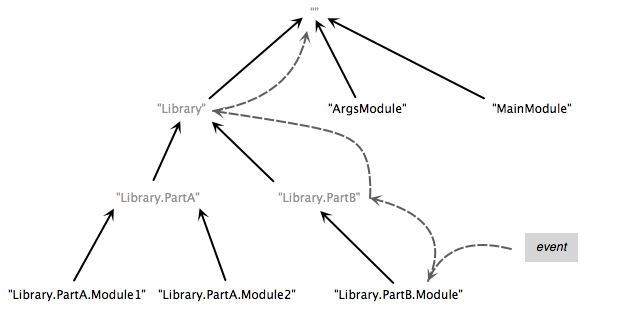
Every log event will be presented to all logger with that name, and to all loggers with a parent name. Each logger will decide according to its level and filter if the event should actually be recorded. Finally, all events are presented to all loggers having the special empty name (corresponding to the string ""). The hierarchy of the loggers is a key feature that allows to easily enable or disable logging for large parts of an application. Figure 3.2 shows how a message initially created for the Library.PartB.Module loggers is dispatched to all loggers with parent names, including loggers that are not explicitly used in the application (those whose name appears in gray). The dashed arrows show the order in which the event is presented to the different loggers.
Linking with Bolt is usually done by adding one of the following library to the linking command-line:
In order to use Bolt in multithread applications, it is necessary to also link with the BoltThread module. This also implies to pass the -linkall option to the compiler.
There are two ways to add a log statement: either by calling explicitly the Bolt.Logger.log function, or by using the bolt_pp.cmo camlp4 syntax extension. One is advised to use the latter method: first, using the syntax extension is lightweight (elements such as line and column are automatically computed); second, it allows to remove the log statements at compilation. Indeed, it may be useful to have a development version packed with a lot of debug log statements and a distributed version that suffers no runtime penalty related to logging. Moreover, only given log statements may be removed, on a level basis.
To log using the Bolt.Logger.log function, one has to call it with the following parameters (cf. code sample 4.1):
let () =
  ...
  Bolt.Logger.log "mylogger" Bolt.Level.DEBUG "some debug info";
  ...
To log using the syntax extension, one has to use the Bolt-introduced LOG expression. This is done by passing the -pp ’camlp4o /path/to/bolt_pp.cmo’ option to the OCaml compiler. The new LOG expression can be used in an OCaml program wherever an expression of type unit is waited. The bnf definition of this expression is as follows:
| log_expr ::= LOG (string | ident) arguments attributes LEVEL level |
| arguments ::= list of expressions | є |
| attributes ::= attributes attribute | є |
| attribute ::= NAME string | (PROPERTIES | WITH) expr | (EXCEPTION | EXN) expr |
| level ::= FATAL | ERROR | WARN | INFO | DEBUG | TRACE |
The string following the LOG keyword is the message of the log event, it can be either a literal string or an identifier whose type is string. This string can be followed by expressions; in this case the string is interpreted as a printf format string, using the following expressions as values for the % placeholders of the format string.
The attributes are optional, and have the following meaning:
Code sample 4.2 shows how the expression can be used. Compared to explicit logging through the Bolt.Logger.log, when using the LOG expression file, line number, and column number are determined automatically.
When no NAME attribute is provided, the logger name is computed from the source file name: the .ml suffix is removed and the result is capitalized. More, the bolt_pp.cmo syntax extension accepts the following parameters:
Finally, the bolt_pp.cmo syntax extension recognizes a third parameter -level <l> where l should be either NONE or a level. If l is NONE, all LOG expressions will be removed from the source file; otherwise, only the LOG expression with a level inferior or equal to the passed value will be kept. This means that TRACE will keep all log statements, while ERROR will keep only log statements with a level equal to either ERROR, or TRACE.
let () =
  ...
  LOG "some debug info" LEVEL DEBUG;
  ...
Note: when compiling in unsafe mode, the -unsafe switch should be passed to camlp4 instead of the compiler. Indeed, as camlp4 is building a syntax tree that is passed to the compiler, issuing the -unsafe switch to the compiler has no effect because it is too late: the code has been built by camlp4 in safe mode. In such a case, the compiler warns the user with the following message: Warning: option -unsafe used with a preprocessor returning a syntax tree. The correct Bolt invocation is hence -pp ’camlp4o -unsafe /path/to/bolt_pp.cmo’.
There are two ways to configure log, that is to register loggers that will handle the log events produced by the application. The first way is to explicitly call Bolt.Logger.register while the second one is to use a configuration file that will be interpreted by Bolt at runtime.
To register (i.e. to create) a logger using the Bolt.Logger.register function, one has to call it with the following parameters:
To register a logger using a configuration file, one should set either the BOLT_FILE or the BOLT_CONFIG environment variable to the path of the configuration file. BOLT_FILE is to be used when the file is written in the old configuration format, while BOLT_CONFIG is to be used when the file is written in the new configuration format. If the configuration file cannot be loaded, an error message is written on the standard error unless the BOLT_SILENT environment variable is set to either “YES” or “ON” (defaulting to “OFF”, case being ignored).
The old format of the configuration file is as follows:
The new format of the configuration file is defined by the following grammar:
| file ::= section_list |
| section_list ::= section_list section | є |
| section ::= logger string { property_list } opt_separator |
| opt_separator ::= ; | є |
| property_list ::= property_list property | є |
| property ::= ident = property_value opt_separator |
| property_value ::= expr | integer | float | string |
| expr ::= ident | ident && ident | ident || ident |
In both formats, each section defines a logger whose name is the section name. The following properties are used to customize the logger:
The level can have one of the following values: TRACE, DEBUG, INFO, WARN, ERROR, FATAL. The possible values for the other properties are discussed in the following sections.
The mode can have one of the following values:
When retained mode is used, the retention parameter defines when data is actually sent to output. The string value can have one of the following form:
Code sample 4.3 and 4.4 exemplify typical configuration files, respectively in old and new format. They define three loggers (with names “”, “Pack.Main”, and “Pack.Aux”). When executed, the application will produce three files “bymodule.result”, “bymodule1.result”, and “bymodule2.result”: the first file will contain the log information for the whole application while the other ones will contain respectively the log information associated with the “Pack.Main” and “Pack.Aux” loggers.
level=trace
filter=all
layout=simple
mode=direct
output=file
name=bymodule.result

[Pack.Main]
level=trace
filter=all
layout=simple
mode=direct
output=file
name=bymodule1.result

[Pack.Aux]
level=trace
filter=all
layout=simple
mode=direct
output=file
name=bymodule2.result
logger "" {
  level = trace;
  filter = all;
  layout = simple;
  mode = direct;
  output = file;
  name = "bymodule.result";
}

logger "Pack.Main" {
  level = trace;
  filter = all;
  layout = simple;
  mode = direct;
  output = file;
  name = "bymodule1.result";
}

logger "Pack.Aux" {
  level = trace;
  filter = all;
  layout = simple;
  mode = direct;
  output = file;
  name = "bymodule2.result";
}
The following filters are predefined:
Bolt predefines the following non-configurable layouts:
Two other layouts are predefined:
The following keys are available for use by the pattern and csv layouts:
There are five predefined outputs, namely void, growlnotify3, bell, say, and file.
The void output discards all data.
The growlnotify output sends the data to the Growl application through the growlnotify command-line utility.
The bell output discards all data, and simply prints a “bell” character on the standard output.
The say output uses the MacOS X command-line utility say to invoke the text-to-speech engine in order to actually vocalize the data.
The file output writes data to a bare file, the name property (or the string value when using Bolt.Logger.register) defines the path of the file to be used4, and the rotate property (or the float option value when using Bolt.Logger.register) gives the rate in seconds at which files will be rotated. It is also possible to use the signal property (set to one one the following values: SIGHUP, SIGUSR1, SIGUSR2) in order to request rotation upon signal reception.
When using rotation or several program instances in parallel, it is convenient for the name to contain a piece of information ensuring that the file name will be unique; otherwise, the same file will be written over and over again. In version 1.0, Bolt supported the % special character that was substituted by a timestamp.
Since version 1.1, Bolt additionally supports a more general $(key) substitution mechanism with the following keys:
Once the log information has been produced by the application, the developer and/or the user will have to review it. Obviously, the review depends on the chosen layout. When the layout is one among simple, default, or pattern, review can easily be done using classical Unix commands such as grep, cut, sed, etc.
When the layout is csv, it can be equally convenient to use either one of the aforementioned command-line tools, or any piece of software able to read csv files such as a database, or a spreadsheet.
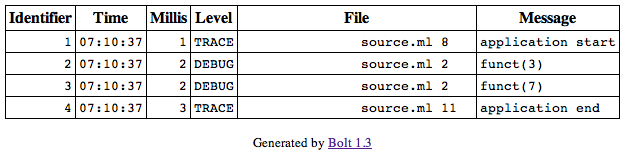
When the layout is html, the evident way to review log is to use a browser in order to have a graphical rendering of the log event. Figure 5.1 shows a small log rendered as a webpage.
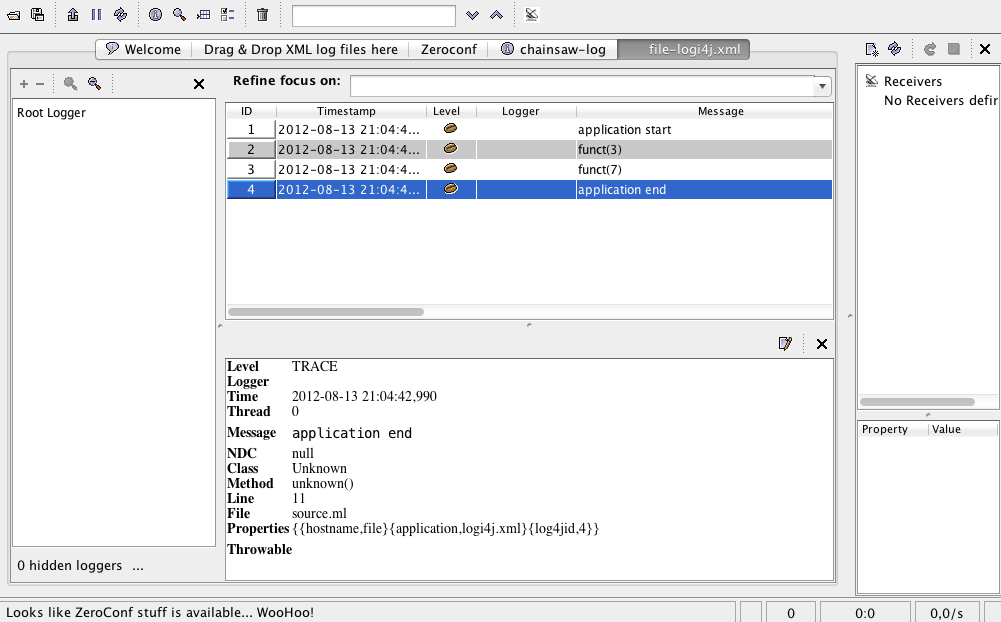
When the layout is xml, a dedicated tool such as a GUI can be helpful. For this reason, the XML layout of Bolt produces log4j-compatible XML files allowing the use of the Apache Chainsaw application1. Code sample 5.2 shows a xml file that could be used to wrap the XML data produced by Bolt (in bolt.xml file) in such a way that Chainsaw can load it. This code sample is a reproduction of the one provided in the Javadoc of the log4j org.apache.log4j.xml.XMLLayout class2. Figure 5.3 shows a screenshot of Chainsaw.
<?xml version="1.0"?>

<!DOCTYPE log4j:eventSet SYSTEM "log4j.dtd" [<!ENTITY data SYSTEM "bolt.xml">]>

<log4j:eventSet version="1.2" xmlns:log4j="http://jakarta.apache.org/log4j/">
        &data;
</log4j:eventSet>
Daikon1 is an invariant detector that detects likely invariants from execution traces. First, programs are instrumented in order to produce traces containing the values of variables at different points. Then, after (several) execution(s), Daikon processes the traces and outputs a list of likely invariants. The invariants are qualified as likely because Daikon is only able to assert that they hold for the given set of executions, but not for any execution.
When using the Daikon tool, it is necessary to produce two elements: both the traces with all recorded variable, and a definition of these variables. To this end, Bolt uses two different layouts: daikon_decls for variable declaration, and daikon_dtrace for actual traces. Typically, this leads to a configuration file akin to the one presented by code sample 6.1 (old configuration format), or code sample 6.2 (new configuration format).
[]
level=trace
filter=all
layout=daikon_decls
mode=direct
output=file
name=daikon.decls

[]
level=trace
filter=all
layout=daikon_dtrace
mode=direct
output=file
name=daikon.dtrace
logger "" {
  level = trace;
  filter = all;
  layout = daikon_decls;
  mode = direct;
  output = file;
  name = "daikon.decls";
}

logger "" {
  level = trace;
  filter = all;
  layout = daikon_dtrace;
  mode = direct;
  output = file;
  name = "daikon.dtrace";
}
As previously said, the programs need to be instrumented in order to produce traces that will be analyzed by Daikon after execution. Such instrumentation is done through logging statements with the designated Daikon.t value as message, and properties are used to indicate which variables should be recorded. This leads to log statements with one of the following form:
Note: the Daikon layouts ignore the EXCEPTION part of the log statements.
Values, independently of their kind (parameters, return values, bare variables) are encoded using a variable-building function from the Daikon module. All these functions take as first parameter the name of the value (as a string), and as second parameter the value itself. As of version 1.4, they are:
where t is one of bool, int, float, or string.
It is also possible to use the combinators tuple2, tuple3, tuple4, tuple5, or make_variable_builder in order to group values.
Code sample 6.3 shows a program that has been instrumented to record values at the start and end of the f function with type int -> int, as well as at intermediary point.
let f x =
  LOG Daikon.t
    WITH Daikon.enter "f" [Daikon.int "x" x] LEVEL TRACE;
  let tmp = x * x in
  LOG Daikon.t
    WITH Daikon.point "interm" [Daikon.int "x" x; Daikon.int "tmp" tmp] LEVEL TRACE;
  let res = tmp mod 2 in
  LOG Daikon.t
    WITH Daikon.exit "f" (Daikon.int "res" res) [Daikon.int "x" x] LEVEL TRACE;
  res

let () =
  let l = [1; 2; 3; 4; 5; 6; 7; 8; 9; 10] in
  let l = List.map f l in
  List.iter (Printf.printf "%d\n") l
Once the program has been run, files “daikon.decls” and “daikon.dtrace” have been generated and can be passed to Daikon for analysis. The result of the analysis is shown at code sample 6.4. A total of six invariants have been computed. The first three link the function result with its paremeter:
The last three link the tmp variable with the function parameter:
===========================================================================
f:::ENTER
===========================================================================
f:::EXIT1
"x" == orig("x")
"res" one of { 0, 1 }
"res" <= "x"
===========================================================================
interm:::POINT
"tmp" % "x" == 0
"tmp" == "x"**2
"tmp" >= "x"
Pajé1 is a metaformat, or self-describing format2, that was designed to enable easy and information-rich tracing of distributed systems. It defines several kinds of events that allow to indicate: a discrete event, a state change, a communication start, a communication end, etc. In its 1.4 version, Bolt supports the 1.2.3 version of the Pajé file format.
Pajé traces are based on the notion of container, which can be used to represent any entity in the system. Containers are organized in a type hierarchy, allowing for example a process to contain several threads. A container can be characterized at any time by its state, which can be changed according to an event. A container can also be characterized by some numeric variables whose value can change according to events. Finally, two containers can be associated through a link in order to model communications.
All Pajé data is modelled by a type hierarchy where containers are tree nodes while event, states, variables, and link are tree leaves. The Pajé format also uses the concept of alias such that types and containers are referred by their alias rather than by their names, allowing shorter traces.
When using the Pajé format, it is necessary to produce two elements: the definition of events used through the traces, and the events actually occurring during a program run. Bolt automatically generate the definitions of events, using the set of predefined event kind from the Pajé format definition. This means that, in the current implementation, it is not possible to add new kinds of events. Nevertheless, it is still possible to add new fields to predefined events. Producing traces in the Pajé format is triggered by choosing the paje layout as shown by code sample 7.1 (old configuration format), or code sample 7.2 (new configuration format).
[]
level=trace
filter=message_paje
layout=paje
mode=direct
output=file
name=paje.trace
logger "" {
  level = trace;
  filter = message_paje;
  layout = paje;
  mode = direct;
  output = file;
  name = "paje.trace";
}
In order to produce a trace containing Pajé events, it is necessary to use logging statements with the special Paje.t value as message, events kind and properties being passed as log properties. The complete list of event kind can be consulted in the ocamldoc-generated documentation for the Paje module, available in the ocamldoc directory after execution of make doc. Code sample 7.3 shows three events: one recording a discrete phenomenon, and two indicating changes of an element state.
Note: the Pajé layout ignores the EXCEPTION part of the log statements.
LOG Paje.t
  PROPERTIES Paje.new_event ~typ:"mail" ~container:"cnt" ~value:msg []
  LEVEL TRACE;

(...)

LOG Paje.t
  PROPERTIES Paje.set_state ~typ:"state" ~container:"cnt" ~value:"computing" []
  LEVEL TRACE;

(...)

LOG Paje.t
  PROPERTIES Paje.set_state ~typ:"state" ~container:"cnt" ~value:"waiting" []
  LEVEL TRACE;
Before using a type, it is necessary to define it through a dedicated event. Types can be defined for any Pajé entity (that is container, state, event, variable, or link). In every function, the properties parameter allows one to specify properties that are not defined by the file format; all properties defined by the file format being passed through named parameters. The name and alias types are bare synonyms for string.
defines a new type for containers, with an optional parent type.
defines a new type for states.
defines a new type for events.
defines a new type for variables.
defines a new type for links.
defines a new type for entity values.
is used to create new containers.
is used to destroy existing containers.
changes the state of a container to a given value.
pushes the current value of a container to its own state, before changing to the given value.
changes the value of a container, by popping a previously pushed value.
clears previously saved states of a container.
is used to indicate a discrete event.
changes the value of a variable to the passed value.
changes the value of a variable by increasing it by a given amount.
changes the value of a variable by decreasing it by a given amount.
is used to indicate the beginning of a link from a container, the key/value pair being used to match with associated end of a link.
is used to indicate the end of a link from a container, the key/value pair being used to match with associated beginning of a link.
While the Pajé format gives great flexibility, it is frequent to have a set of static types defined at program start and then used during trace generation. For this reason, Bolt provides a functorized interface that allows to define types in a module to be passed to the Paje.Make functor. As a result, one obtains a module akin to Pajé with the previously presented functions, except that:
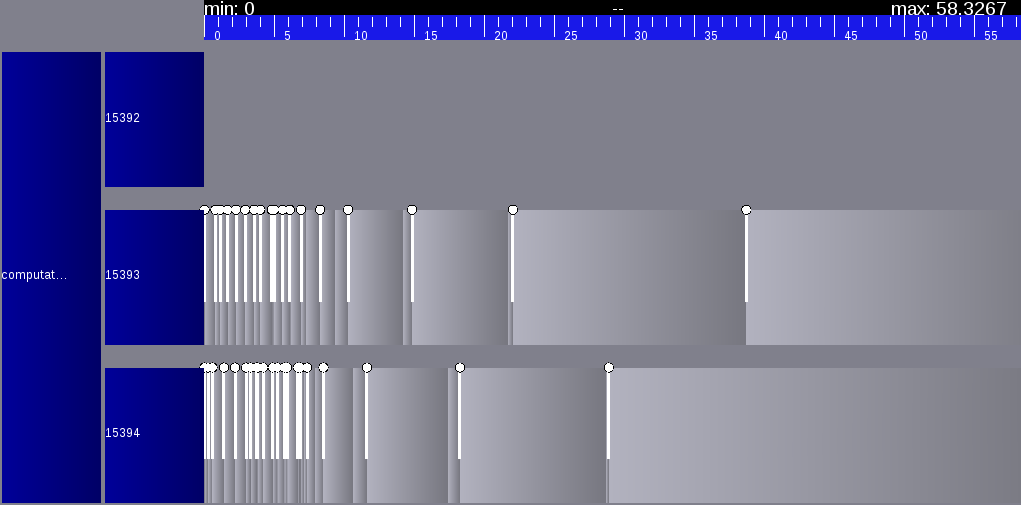
The traces using the Pajé format are not easily analyzed directly by a user. It is thus necessary to use a dedicated tool such as Pajé itself, or the ViTE3 trace visualizer. ViTE will depicted states through colored rectangle, discrete events through small discs, and communication events (named links in the Pajé format) through arrows. This visual representation is a great help for the understanding of a system with multiple communicating entities. Moreover, the ViTE tool is able to compute statistics about states. Figure 7.4 shows a typical ViTe representation of log events.
Code sample 8.1 shows a short program using the implicit logging feature of Bolt. The program can be compiled and executed by the Makefile shown by code sample 8.2. The compile target underlines that compilation should be done through the Bolt preprocessor, and that link entails references to the unix, and dynlink libraries (both being shipped with the standard OCaml distribution).
let funct n =
  LOG "funct(%d)" n LEVEL DEBUG;
  for i = 1 to n do
    print_endline "..."
  done

let () =
  LOG "application start" LEVEL TRACE;
  funct 3;
  funct 7;
  LOG "application end" LEVEL TRACE
DEPENDENCIES=unix.cma dynlink.cma

default: clean compile run-new view

clean:
        rm -f *.cm* log bytecode

compile:
        ocamlc -c -I +bolt bolt.cma \
            -pp 'camlp4o path/to/bolt/bolt_pp.cmo' source.ml
        ocamlc -o bytecode -I +bolt $(DEPENDENCIES) bolt.cma source.cmo

run-old:
        BOLT_FILE=config.old ./bytecode

run-new:
        BOLT_CONFIG=config.new ./bytecode

view:
        cat log
The targets run-old and run-new of the Makefile show that the environment variable BOLT_FILE or BOLT_CONFIG should be set to the path of the configuration file defining the actual runtime-configuration of logging. The related configuration files are respectively represented by code samples 8.3 and 8.4. As a result of execution, a plain text file named log will be produced, and can be viewed using the view target of the Makefile. Code sample 8.5 shows the contents of the log file.
level=trace
filter=all
layout=default
mode=direct
output=file
name=log
logger "" {
  level = trace;
  filter = all;
  layout = default;
  mode = direct;
  output = file;
  name = "log";
}
       2 [       source.ml 8    ] TRACE - application start
       4 [       source.ml 2    ] DEBUG - funct(3)
       4 [       source.ml 2    ] DEBUG - funct(7)
       4 [       source.ml 11   ] TRACE - application end
It is also possible to compile the source.ml file through the ocamlbuild tool. The most convenient way is to first define a new bolt tag in a myocamlbuild.ml plugin. This tag will add the necessary elements when compiling or linking a file using the Bolt features, as shown by code sample 8.6. Then, it is sufficient to use the newly-introduced tag in the _tags file to use Bolt, as shown by code sample 8.7.
open Ocamlbuild_plugin
open Ocamlbuild_pack

let () =
  dispatch begin function
    | After_rules ->
        flag ["bolt"; "pp"]
          (S [A"camlp4o"; A"/path/to/bolt/bolt_pp.cmo"]);
        flag ["bolt"; "compile"]
          (S [A"-I"; A"/path/to/bolt"]);
        flag ["bolt"; "link"; "byte"]
          (S [A"-I"; A"/path/to/bolt"; A"bolt.cma"]);
        flag ["bolt"; "link"; "native"]
          (S [A"-I"; A"/path/to/bolt"; A"bolt.cmxa"]);
        flag ["bolt"; "link"; "java"]
          (S [A"-I"; A"/path/to/bolt"; A"bolt.cmja"])
    | _ -> ()
  end
<source.*>: use_unix, use_dynlink, bolt
It is possible to customize Bolt by defining new filters, layouts, and outputs. This is easily done by using respectively the Bolt.Filter.register, Bolt.Layout.register, and Bolt.Output.register functions. The following sections give examples of how this can be done. More information about the actual types and functions can be found in the ocamldoc-generated documentation (available in the ocamldoc directory, generation being triggered by the make doc command).
A filter is barely a function from Bolt.Event.t to bool. It is possible to write explicitly the function, or to rely on predefined filters assembled through combinators provided by the Bolt.Event module. Code sample 9.1 shows the definition of two filters: the first one is explicitly coded and only keep events whose line number is even, while the second one is encoded through combinators and keep events with neither exception nor property.
let () =
  Bolt.Filter.register
    "even_line"
    (fun e -> (e.Bolt.Event.line mod 2) = 0)

let () =
  Bolt.Filter.register
    "no_exception_and_no_property"
    (let open Bolt.Filter in
     exception_none &&& properties_empty)
A layout is a triple containing: a header (as a string list), a footer (as a string list), and a rendering function (as a function from Bolt.Event.t to string). Code sample 9.2 shows the definition of a layout with empty header and footer, and a rendering function based on Printf.sprintf.
let () =
  Bolt.Layout.register
    "printf_layout"
    ([], (* header *)
     [], (* footer *)
     (fun e ->
       Printf.sprintf "file \"%s\" says \"%s\" with level \"%s\" (line: %d)"
         e.Bolt.Event.file
         e.Bolt.Event.message
         (Bolt.Level.to_string e.Bolt.Event.level)
         e.Bolt.Event.line))
An output is a function taking a string parameter, a Bolt.Output.rotation parameter, and a Bolt.Layout.t parameter to build an Bolt.Output.impl object. The semantics of the string parameter is to be defined by the output itself (for the file output, it is the filename of the destination). The Bolt.Output.rotation parameters defines when a rotation should happen (based on time and/or signal interception). Finally, the layout indicates header and footer to write at each rotation.
The Bolt.Output.impl object to be built by a layout should define two methods:
Code sample 9.3 shows the definition of a layout using the mail system command to log elements.
let () =
  let send_mail _ _ _ =
    object
      method write msg =
        try
         let command = Printf.sprintf "mail -s %S dest@domain.com" msg in
         ignore (Sys.command command)
        with _ -> ()
      method close = ()
    end in
  Bolt.Output.register "send_mail" send_mail
In order to compile source files containing the definition of custom elements, it is sufficient to add the path to the Bolt library to the compiler search path (i.e. through -I +bolt).
When custom elements have been registered using the previously mentioned functions, they can be used from the configuration files or from the Bolt.Logger.register function. However, it is necessary for the custom elements to be registered before any log event concerned with these custom elements is built. Otherwise, elements won’t be found and Bolt will resort to default values.
A good practice is to define the new filters, layouts, and outputs in modules that are not part of the application. One should not forget to pass the -linkall switch to the compilers when linking such modules. Another option is to avoid linking these modules with the application, and to use the BOLT_PLUGINS environment variable to load them. The BOLT_PLUGINS environment variable contains a comma-separated list of files that will be loaded through Dynlink.
This document was translated from LATEX by HEVEA.